
Power quality · Energy audits · Solar
Smart energy data drives smart decisions
t·power Energy Solutions helps businesses, institutions and industry in Kenya find out what is really happening on their supply, then fix it: power quality, energy audits, monitoring, efficiency and solar.
Illustration: a voltage sag as a power analyser records it.
Warning signs
Often we rely on operational symptoms
These are the signs clients notice before they call us. Each one has a cause that can be measured.
Breakers tripping mid-operation
Trips with no obvious overload can point to voltage dips, harmonics or an unbalanced load.
Lights flickering
Flicker usually means the voltage is rising and falling, often because of a large load nearby.
Equipment overheating
Hot motors, cables and transformers waste energy and wear out sooner.
Unusual noise or vibration
Humming transformers and noisy motors are often a sign of distortion or imbalance.
Acting on symptoms alone can lead to downtime, damage or wasted investment. We measure first.
Book a free site assessmentWhat we do
Energy solutions, from measurement to solar
Every service starts with how your site really uses power, so the fix fits the problem.
Energy Audits
An in-depth assessment of your energy systems that uncovers inefficiencies and identifies where you can save.
Learn more Measure and fixPower Analysis & Optimisation
We analyse your supply for voltage dips, harmonics and imbalance, then put in place solutions that stabilise and protect your equipment.
Learn more MeasureEnergy Monitoring
Smart monitoring systems that track your real-time energy use, for data-driven decisions, better control and continuous reporting.
Learn more GenerateRenewable Energy
We design and install solar PV systems that reduce your dependence on the grid, lower your bills and support your green goals.
Learn more ImproveEnergy Efficiency
LED retrofits, HVAC optimisation or motor upgrades: we manage projects that deliver fast returns and long-term savings.
Learn more ProtectElectrical Safety Audits
Power starts with safety. Electrical safety audits keep your people and your equipment safe.
Learn morePower quality
What a power analyser finds
Nine common disturbances, drawn the way an analyser shows them. The dashed line is a healthy 50 Hz supply.
Voltage sag
A short drop in voltage, typically from large motors starting or faults on the network. Equipment resets, contactors drop out.
Voltage swell
A short rise above normal voltage, often when large loads switch off. Stressed insulation, failed electronics.
Harmonic distortion
A distorted waveform caused by drives, UPS units, LED drivers and other electronic loads. Hot transformers and neutrals, nuisance trips.
Transient overvoltages
Very fast spikes from switching or lightning. Damaged electronics, unexplained failures.
Interruption
A complete loss of supply, from a few cycles to minutes. Downtime, lost production and data.
Voltage unbalance
The three phases carry unequal voltages, usually from uneven single-phase loads. Motors overheat and lose life.
Voltage fluctuations
Repeated rises and falls in voltage from fluctuating loads. Visible light flicker.
Frequency variation
The supply drifts from 50 Hz, most often on generators or weak supplies. Clocks, motors and drives misbehave.
Poor power factor
Current lags behind voltage, so more current is drawn for the same useful work. Higher bills and overloaded cables.
Data leads the way
Measure before you spend
Smart energy data drives smart operational decisions. Monitoring and audits show you where the energy and the money go.
- Detects hidden inefficiencies early
- Supports data-backed financial planning
- Simplifies stakeholder reporting
- Improves equipment reliability
- Enables accurate solar and system sizing
Power stability is a strategy
Take control. Choose solar.
A solar system sized from your measured load makes your energy costs easier to plan.
- Reduced dependence on the grid
- More predictable energy costs
- Savings from the day the system runs
- Long-term budget stability
How we work
From first visit to ongoing support
- STEP 1
Needs assessment
We visit, listen and measure, so we understand your site and what you are seeing.
- STEP 2
Solution design
We design the fix around the data, and explain the options and costs.
- STEP 3
Seamless implementation
We install with as little disruption to your operations as we can.
- STEP 4
Ongoing support
We stay on hand with monitoring, maintenance and advice.
Why choose us
The right partner for reliable power
Choosing the right electrical solutions provider is crucial for efficiency, reliability and long-term success.
Our partners




Insights
Notes from the field

Understanding Kenya’s 2025 Energy Regulations – What You Need to Know
The Energy and Petroleum Regulatory Authority (EPRA) has created the Energy Management Regulations 2025, marking an important step in Kenya’s journey toward…
Understanding IP & IK Ratings
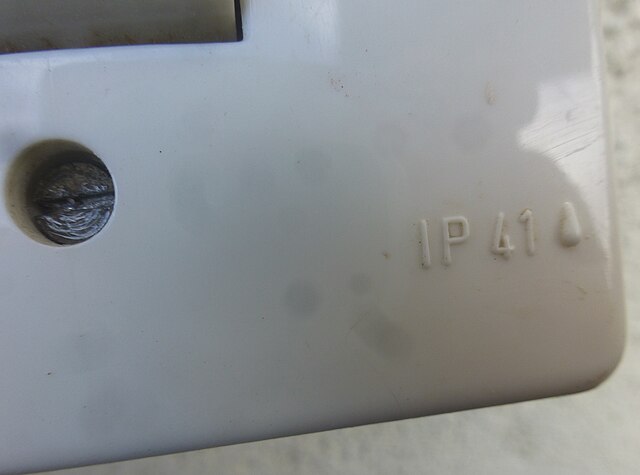
Introduction In the world of electrical and industrial equipment, durability is non-negotiable. When deploying devices in harsh environments—whether exposed to dust, water,…
What is Good Power?
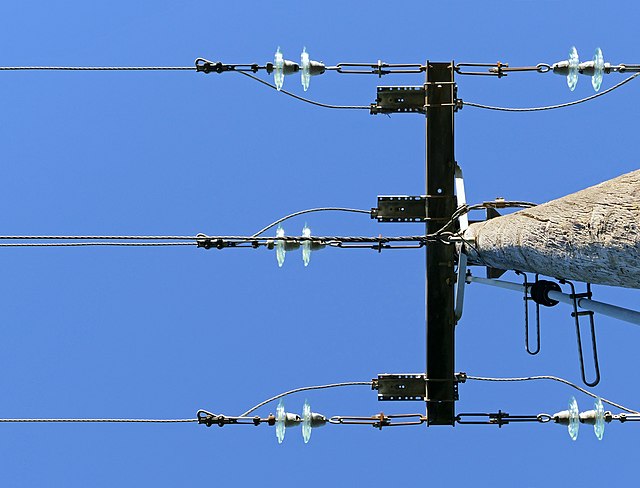
Voltage Sag What is Voltage Sag? Voltage sag, also known as a voltage dip, refers to a short-duration reduction in the RMS…
Free site assessment
Book your free site assessment
Tell us what you are seeing (tripping, flicker, heat, high bills) and we will come and measure. Data first, then the fix.