POWER QUALITY AUDIT REPORT
(EN50160)
CLIENT:
SAMPLE COMPANY (TRUE DATA)
NAIROBI
(MAIN FACTORY)
STUDY AND REPORT BY:
THORN ELECTRICALS LIMITED
P.O. BOX 47410-00100, GPO NAIROBI, KENYA.
TEL: +254 (20) 8067778/9 FAX: +254 (20) 2301777
INTRODUCTION
This is a report of testing to the EN50160 standard that was performed on data recorded at Sample Company Limited factory site. This report covers the interval from:
Thursday, June 9th, 2019 10:25 AM to Sunday, June 12th, 2019 8:00 AM
This report is composed of:
- Summary of tests: This section is a brief summary of the results of these tests.
- Results: This section contains the results of testing to the EN50160 standard. This includes the following charts and compliance tests: • Volts/Amp/Hz
- Dips & Swells
- Harmonics
- Power & Energy (Power Factor)
- Flicker
- Unbalanced Load
- Transients
- Inrush
- Mains Signaling
- Observations: This section discusses various observations noted during the study.
- Power Quality Improvement Recommendations: This section deals with specific recommendations that would help improve Power Quality Problems related to this facility.
- Energy Saving Recommendations: This section covers general recommendations that help save energy.
- Occupational Health & Safety Recommendations: This section covers occupational health & safety related issues.
- General Recommendations: This section deals with general issue related to Power.
- Compliance limits: This section contains the compliance limits over which this report was run.
- Appendix 1 – Power Quality Tutorial.
SUMMARY OF TESTS (MAIN BOARD)
| EN50160 Results for this location | ||
| Frequency | PASS | Compliance Table # 4 |
| Supply Voltage Unbalance | PASS | Compliance Table # 1 |
| Voltage Variation Magnitude | PASS | Compliance Table # 2 |
| Current Imbalance | CONCERN | Compliance Table # 3 |
| Flicker | CONCERN | Compliance Table # 11 |
| Power Factor | CONCERN | Compliance Table # 10 |
| Harmonics | PASS | Compliance Table # 9 |
| Voltage Dips, Swells & Interruptions | CONCERN | Compliance Table # 5,6,7,8 |
| Temporary Over Voltages – Conductor to Earth | PASS | Compliance Table # 12 |
| Transient Over Voltages – Conductor to Earth | PASS | Compliance Table # 12 |
Based on the tests that were run, the following areas need to be looked at in detail:
- Current Unbalance
- Flicker
- Power Factor
- Voltage Dips, Swells & Interruptions
RESULTS
1. VOLTS/AMPERAGE/HERTZ
A. VOLTAGE & AMPERAGE
This chart displays the 5 minute mean rms value of the supply voltage under normal operating conditions, including situations arising from faults or voltage interruptions. Supply voltage variations are an increase or decrease of voltage normally due to variation of the total load of a distribution system or a part of it. This is a low voltage (LV) system (nominal rms value ≤ 1kV).

Chart1 – Voltage/Amperage Chart
Compliance Table 1 – Supply Voltage Unbalance
| Limit | Parameter for Compliance to Pass | Unbalance Vneg (Min) | Unbalance Vneg (Ave) | Unbalance Vneg (Max) | Result |
| ±2 % | 95% of measurements | 100% | 99.49% | 98.59% | PASS |
| The supply voltage unbalance compliance passed successfully. There was 15 Cou could be attributed various Interruption incidents that took place during the logg Compliance Table 2 – Voltage Magnitude Variations (Limit of ± 10% Un) | nts of violatio ing period. He | n observed at various times which nce the compliance was achieved. | |||
| Limit | Parameter for Compliance to Pass | L1 % | L2 % | L3 % | Result |
| ± 10% Un | 95% of measurements | 99.43% | 99.51% | 99.51% | PASS |
On calculation of the Voltage Magnitude Variations compliance using ± 10% limits, the compliance was achieved successfully. There were 8, 6 and 9 Counts of violation observed on L1, L2 and L3 respectively. Most of these counts were caused due to Interruptions in the supply of Power from the Utility Company.
Compliance Table 3 – Current
| Limit | Parameter for Compliance to Pass | L1 % | L2 % | L3 % | Result |
| −10% / +10% Un | 100% of measurements | 96.11% | 99.35% | 91.25% | CONCERN |
There were various counts of 9, 3 and 2 violated readings on L1, L2 and L3 respectively. This compliance did not pass and further investigation is recommended.
B. FREQUENCY (HERTZ)
This chart displays the mean value of the fundamental frequency measured over 10 seconds under normal operating conditions.
Chart2 – Frequency Chart

Compliance Table 4 – Frequency
| Limit | Parameter for Compliance to Pass | Actual % | Result | |
| ±1% (49.5 – 50.5 Hz) | 99.5% of measurements | 99.87% | PASS | |
| -6%/+4% (47- 52 Hz) | 100% of measurements | 100% | PASS |
The Frequency compliance passed successfully. There was 1 Count of violation observed at 7:43:51. The actual noted readings were
99.66% which is greater than the limit of 99.5% hence the compliance was achieved successfully.
2. DIPS AND SWELLS
This chart displays the dips and interruptions of the supply voltage. Dips are a sudden reduction of the supply voltage to a value between 90% and 1% of the nominal voltage Un, followed by a voltage recovery after short period of time. Interruptions are a condition in which the voltage at the supply terminals is lower than 1% of the nominal voltage Un. The results from all of the phases are consolidated for this presentation.

Chart3 – Dips, Swells & Interruptions
| Voltage % Un | Duration in seconds | |||||||
| 0.01<0.1 | 0.1<0.5 | 0.5<1 | 1<3 | 3<20 | 20<60 | 60<180 | >180 | |
| Dips | ||||||||
| 85 < 90 | 1 | |||||||
| 70 < 85 | ||||||||
| 60 < 70 | 1 | |||||||
| 50 < 60 | 1 | |||||||
| 40 < 50 | 2 | |||||||
| 30 < 40 | 1 | 1 | ||||||
| 20 < 30 | 1 | 1 | ||||||
| 10 < 20 | 1 | |||||||
| 1 < 10 | 1 | |||||||
| Interruptions | ||||||||
| < 1% Un | 6 | 4 | 4 | |||||
There was 1 instance of a Dip noted on L2 at 15:39:35 for 0.252ms and drop of 99% of the Un Voltage and one instance of an interruption.
Compliance Table 5 – Dips
| Dips (%Un) ≤ 1 second | Parameter for Compliance to Pass | L1 Counts | L2 Counts | L3 Counts | Result |
| 60% <90% of Un | Not Specified | 2 | 1 | 0 | CONCERN |
| 1%<60% of Un | 0 Counts | 3 | 6 | 3 | CONCERN |
Compliance Table 6 -Dips
| Dips (%Un) > 1 second | Parameter for Compliance to Pass | L1 Counts | L2 Counts | L3 Counts | Result | |
| 60% <90% of Un | Not Specified | 0 | 0 | 0 | PASS | |
| 1%<60% of Un | 0 Counts | 0 | 0 | 0 | PASS |
This compliance did not pass as the required limit is 0 Counts for compliance.
Compliance Table 7 – Interruptions
| Interruptions (<1% of Un) | Parameter for Compliance to Pass | L1 Counts | L2 Counts | L3 Counts | Result |
| Short (<=180 Sec) | 0 Counts | 4 | 4 | 4 | CONCERN |
| Long (>180 Sec) | 0 Counts | 4 | 4 | 4 | CONCERN |
This compliance did not pass as the required limit is 0 Counts for compliance. However, the mitigation of this power problem is achieved by installation of a Standby Diesel Generator Set.
| Voltage % Un | Duration in seconds | |||||||
| 0.01<0.1 | 0.1<0.5 | 0.5<1 | 1<3 | 3<20 | 20<60 | 60<180 | >180 | |
| Swells | ||||||||
| 110<130 | 4 | 1 | 1 | 2 | 2 | 1 | ||
| 130<150 | 1 | |||||||
| 150<170 | ||||||||
| 170<190 | ||||||||
| 190<210 | ||||||||
| 210<1.5KV | ||||||||
| 20 < 30 | ||||||||
| ≥1.5KV | ||||||||
There was 1 instance of a Swell on L2 at 15:42:09 for 11s.219ms.
Compliance Table 8 – Swells
| Swells (%Un) | Parameter for Compliance to Pass | L1 Counts | L2 Counts | L3 Counts | Result |
| >1.1 of Un | 0 Counts | 0 | 3 | 9 | CONCERN |
This compliance did not pass as the required limit is 0 Counts for compliance.
3. HARMONICS
These charts show a summary of the results of the 10 minute mean RMS values of the supply voltage THD and harmonics under normal operating conditions. Harmonics are caused mainly by customers’ nonlinear loads connected to all voltage levels of the supply system.

Chart4 – Voltage & Current Harmonics
Compliance Table 9 – Voltage Harmonics
| Harmonics Order | Parameter for Compliance to Pass : 95 % of measurements | L1 % of Counts | L2 Counts | L3 Counts | Result | |
| THD | 99.49% | 99.49% | 99.61% | PASS | ||
| 2 | 100.00% | 99.87% | 99.87% | PASS | ||
| 3 | ≤5.0% | 100.00% | 99.87% | 100.00% | PASS | |
| 4 | ≤1.0% | 99.87% | 99.87% | 99.87% | PASS | |
| 5 | ≤6.0% | 100.00% | 100.00% | 100.00% | PASS | |
| 6 | ≤0.5% | 99.74% | 99.87% | 99.61% | PASS | |
| 7 | ≤5.0% | 100.00% | 100.00% | 100.00% | PASS | |
| 8 | ≤0.5% | 99.74% | 99.87% | 99.87% | PASS | |
| 9 | ≤1.5% | 100.00% | 99.87% | 100.00% | PASS | |
| 10 | ≤0.5% | 99.74% | 99.87% | 99.87% | PASS | |
| 11 | ≤3.0% | 100.00% | 100.00% | 100.00% | PASS | |
| 12 | ≤0.5% | 99.74% | 99.87% | 99.87% | PASS | |
| 13 | ≤3.0% | 100.00% | 100.00% | 100.00% | PASS | |
| 14 | ≤0.5% | 99.74% | 99.87% | 99.87% | PASS | |
| 15 | ≤0.5% | 99.74% | 99.87% | 99.74% | PASS | |
| 16 | ≤0.5% | 99.74% | 99.87% | 99.87% | PASS | |
| 17 | ≤2.0% | 100.00% | 100.00% | 100.00% | PASS | |
| 18 | ≤0.5% | 99.87% | 99.87% | 99.87% | PASS | |
| 19 | ≤1.5% | 100.00% | 99.87% | 100.00% | PASS | |
| 20 | ≤0.5% | 99.87% | 99.87% | 99.87% | PASS | |
| 21 | ≤0.5% | 99.74% | 99.87% | 99.87% | PASS | |
| 22 | ≤0.5% | 99.87% | 99.87% | 99.87% | PASS | |
| 23 | ≤1.5% | 100.00% | 99.87% | 100.00% | PASS | |
| 24 | ≤0.5% | 99.87% | 99.87% | 99.87% | PASS | |
| 25 | ≤1.5% | 100.00% | 99.87% | 100.00% | PASS | |
4. POWER AND ENERGY

Compliance Table 10 – Power & Energy (Power Factor)
| Power Factor | Parameter for Compliance to Pass: 100% of measurements | L1 Counts | L2 Counts | L3 Counts | TOTAL (PF) | Result |
| PF ≥0.9 | 0 Counts | 95 % | 48 % | 32 % | 50 % | CONCERN |
Poor Power Factor has big financial implications for any organization. Kindly refer to recommendations provided in the recommendations section.
5. FLICKER
This chart displays the long term flicker severity caused by voltage fluctuations under normal operating conditions. Flicker is the impression of unsteadiness of visual sensation induced by a light stimulus whose luminance or spectral distribution fluctuates with time.

Compliance Table 11 – Flicker
| Limit | Parameter for Compliance to Pass | L1 % | L2 % | L3 % | Result | |
| Plt≤1 | 95% of measurements | 97% | 97% | 94% | CONCERN |
This compliance did not pass as the required limit is Plt≤1.0 Counts for 95% of Logged time. The limits were violated onL3.
6. TRANSIENTS
Transients are fast spikes on the voltage (or current) waveforms. There were no incidences of transients in the 24 hour logging sessions. For an in depth analysis of transients, a logging session of 2 weeks is recommended. Nevertheless, there are various recommendations given to improve the facility’s protection against transients.
Compliance Table 12 – Transients
| Limit | Parameter for Compliance to Pass | L1 Counts | L2 Counts | L3 Counts | Result | |
| <6KV | 0 Counts | 0 | 0 | 0 | PASS |
There was no instant of transients recorded. Nevertheless, due to the destructive nature of high transients please refer to the recommendations section for various recommendations.
7. MAINS SIGNALING
This chart displays the Mains Signaling of the system. Power distribution systems often carry control signals to switch appliances on and off remotely (also known as ripple control). These control signals have a frequency that is higher than the normal 50 or 60 Hz line frequency and range up to about 3 kHz. Amplitude is significantly lower than that of the nominal line voltage. The control signals are present only at the moments that a remote appliance has to be controlled.

To capture control signals it is essential to know their frequencies in advance from the local utility company. Due to lack of any information regarding the frequencies from the local Utility company, it is not possible to determine the compliance of Main Signaling.
| KVA DEMAND | No. of Counts | % of Counts |
| >950 KVA | 2 | 0.72% |
| >925 KVA | 3 | 1.08% |
| >900 KVA | 3 | 1.08% |
| >875 KVA | 10 | 3.58% |
| >850 KVA | 66 | 23.66% |
The Demand KVA data was calculated in 15Mins Average to understand the potential savings possibilities by application of Load Shedding techniques. It was observed that only 10 Counts out for a total of 279 were above 875 KVA.
In March 2011, the company had a Demand KVA of 991 which cost Kshs. 594,600.00. If there was a Load Shedding Program in place and the set KVA Demand was tagged at 875 KVA, the company would have saved Kshs. 69,600.00.
Therefore, the company has a potential to save close to Kshs. 850,000.00 Per Annum with the employment of a good Load Shedding Program.
OBSERVATIONS:
Below are some of the observations made during the study:
- It was noted that during heavy rain water spills into the main switchboard rooms.
- There was a humming noise from the main switchboard which would be attributed to lose connection.
- Most of the motors use either Direct on Line or Star-Delta starting methods including the big motors as 110kW (Pneumatic Fan-FN301), 55kW (Pneumatic Fan-FN301), 37kW (Roll-2M020).
- No surge arrestor was identified in any of the mains and control panels.
- The entire factory lighting comprises mainly of Fluorescent Lamps that use magnetic ballast.
POWER QUALITY IMPROVEMENT RECOMMENDATIONS:
- Current Unbalance (Compliance Table 4)
There were instances of Current Unbalance noted on all 3 Phases which was mainly evident during low loads. There were instances of 3.89%, 0.65% and 8.75% of out of limit readings on L1, L2 and L3 respectively.
We recommend a refined single line mapping of the whole electrical system of the facility to identify locations of all single phase connections (mainly the lighting and office distribution network) to help in balancing loads equally between all 3 phases.
- Voltage Dips, Swells & Interruptions (Compliance Table 5,6,7,8)
There were instances of Dips, Swells and Interruptions as noted in the Compliance Tables 5,6,7,8. Dips, Swells and Interruption have various effects on the equipment and motors of an organization. Refer to the Power Quality Tutorial in Appendix 1.
We recommend the use of a Dynamic Voltage Restorer (DVR) for mitigation of Dips and Sags. This device is series coupled to the load and generates the missing part of the supply; if the voltage dips to 70%, the DVR generates the missing 30%. The correct type and rating is determined after further studies and in view of the total mitigation requirement.
- Power Factor (Compliance Table 10)
As observed in the Compliance Table # 11, there was lagging power factor in almost 50% of the logging period. It was also noted that the power factor dropped heavily during low operational loads. Power Factor has vast financial implications and solving the power factor problem will give the firm instant savings. Low power factors mean high currents drawn for the supply to the loads therefore it requires that the cables and source supply system be oversized to accommodate higher currents. The power factor value is recommended to be stable between 0.95 and 0.99.
We recommend that the actual sizing of the capacitor bank be done taking into account the high and low load demand requirements.
The new capacitor bank should incorporate small capacitor bank to cater for the low load reactive power demands. Furthermore, all Fluorescent Tubes magnetic ballast starters (PF = 0.7) should be replaced with Electronic Ballast with a PF of 1 to help improve the Power Factor during Low Loads operations.
- Flicker (Compliance Table 11)
As observed in Compliance Table # 11, L1 and L2 had 97% of logged reading where not in compliance to the limit of Plt<1. The compliance limit is 95% of total logged reading to be >1. Hence, the reading was 2% off the permissible limits.
Excessive flicker can cause migraine and is responsible for some instances of the so-called ‘sick building syndrome’. We recommend the installation of voltage regulators and soft start devices for motors, lights and welding machines.
- Earthing
Transient voltage surge suppressor (TVSS) units were not evident on any of the electrical distribution equipment we inspected or tested at. We recommend the installation of a properly sized high quality TVSS unit on the main electrical switchboard. The main TVSS unit will mitigate or remove any and all transient voltage spike and surge disturbances caused externally to the building (lightning, electrical storms, downed power lines, utility company switching, high winds, tree branches, other utility customers in close proximity, etc.) Also secondary sub panel or final point of protection TVSS units should be installed on or at ALL critical equipment especially electronic loads (fire alarm, security, telephone, roof HVAC, elevators, etc.) to address or clamp internally generated switching transient/surge events created by all electrical and electronic equipment being turned off and on or duty cycled within the building. The secondary level of protection would also act as back up protection should the primary TVSS unit become damaged or sacrificial.
ENERGY SAVING RECOMMENDATIONS:
1) Motor Starting Technologies to be employed
It was identified that most motors were either fitted with Direct on Line (DOL) or Star-Delta Starting switchgears. This starting methods increase the overall kVA demand during the starting of the motors and also current therefore necessitating over sizing of motor supply cables.
We therefore recommend that for motors above 5.5KW (7.5HP) either a Soft starter or Variable Speed Drive be installed depending on the control function to replace the Direct on Line (DOL) or Star-Delta starters.
Soft Starters and Variable speed drives are also energy saving motor control devices which limit the starting currents of a motor. We also advice that the large and expensive motors be equipped with Motor Condition Monitors to help reduce the down times due to faults on the motor or the loads. Motor Condition Monitors gives you the current condition of the motor and free programmable alarms for notification.
2) Lighting Saving Opportunities
It was noted that Rafiki Millers Ltd uses standard fluorescent lights which use normal magnetic ballast that are energy hungry.
We recommend that the current fluorescent lightings (T12) with magnetic ballast be replaced with energy savings fluorescent lamps (T8) with electronic ballast. Electronic ballasts save up to 25% of energy, are light in weight and have low noise.
3) Energy Management System
In order to keep track and control of the total amount of energy consumed, we recommend that Rafiki millers implement a total Energy Management System by installing software based meters in all the major energy consuming areas. This can then be networked to a management centre where decisions of load switching can be made in order to regulate the amount of energy used per given period.
OCCUPATION HEALTH & SAFETY RECOMMENDATIONS:
- A total FACILITY PROTECTION SYSTEM should be implemented to safeguard personnel and all equipment from Lightning, transient voltages, step potential, touch potential. This kind of a system is the interdependence between lightning protection, grounding, equipotential bonding and surge protection. The interpedently disciplines recommended by Thorn are as follows: a. Capturing the Lightning strike.
- Convey this energy to ground through a low impedance path.
- Dissipate the energy into the grounding system through high quality electrical down conductors, earth rods and low resistivity ground systems.
- Bonding all ground points together using equipotential bonding (molecular bonding). Protect all incoming AC power feeders to arrest fault currents arising from the utility side.
- New OSHA requirements have been issued regarding Arc Flash recommendations and personnel safety. New Arc Flash requirements will require all facilities (Industrial, Commercial, and Institutional) to display information about the arc flash availability at each panel, switch or breaker where the equipment is accessible by maintenance/site personnel. The arc flash information on the panel fronts will indicate the level of clothing and level of training required to open and maintain the equipment within the panel or switchboard.
GENERAL RECOMMENDATIONS:
- Dust and damp condition was evident in areas housing the Switch gear panels. The presence of dust was noted inside switch boards and the motor control panel. The distribution and motor control panels need to be regularly cleaned.
The presence of wet floors and walls in the rooms where the electrical distribution and motor control panels are located poses a great risk of shocks and explosions due to splashes of water coming into contact with cables, bare terminals of the switchgears. We recommend that the distribution and motor control panels be regularly cleaned and remain closed.
- The load cables should be laid in suitable cable trunkings / ducts to protect them from dragging, stepping and splash water. They should be checked regularly for insulation worn-out or degradation. All the supply and load feed cables should be laid in conduits or trunkings fully covered and far from leaking pipes. A standard electrical practice of installing the cable runways above water or other any liquid should always be observed. (IEC 60364)
- Thorn Power recommends REGULAR ELECTRICAL INSPECTIONS, CLEANING AND TESTING of electrical equipment to assist in identifying deteriorated insulation, abnormal operating temperatures and malfunctioning protective devices prior to equipment failure.
- All electrical protective equipment including ground fault relays, circuit breakers and fused disconnects should be tested, exercised and lubricated on a regular basis. Mechanical equipment may not operate properly when called upon if regular maintenance is neglected.
- Protective clothing for staff should have the capabilities to arc fault protection for categories 1, 2, 3 &4. All the protective gears should be insulation rating of 1kV (1000V) at all times. This must be worn at all times when handling electrical switchboards and machines. The protective gears include electrical arc shields, goggles, insulated rubber gloves, switchboard/dielectric mats, arc suppression blankets and insulated hand tools.
(Further notes included in Appendix I)
COMPLIANCE LIMITS
| No | Parameter | Supply voltage characteristics according to EN 50160 | Low voltage characteristics according to EMC standard EN 61000 | |
| EN 61000-2-2 | Other parts | |||
| 1 | Power frequency | LV, MV: mean value of fundamental measured over 10 s ±1% (49.5 – 50.5 Hz) for 99.5% of week -6%/+4% (47- 52 Hz) for 100% of week | 2% | |
| 2 | Voltage magnitude variations | LV, MV: ±10% for 95% of week, mean 10 minutes rms values | ±10% applied for 15 minutes | |
| 3 | Rapid voltage changes | LV: 5% normal 10% infrequently Plt ≤ 1 for 95% of week MV: 4% normal 6% infrequently Plt ≤ 1 for 95% of week | 3% normal 8% infrequently Pst < 1.0 Plt < 0.8 | 3% normal 4% maximum Pst < 1.0 Plt < 0.65 (EN 61000-3-3) 3% (IEC 61000-2-12) |
| 4 | Supply voltage dips | Majority: duration <1s, depth <60%. Locally limited dips caused by load switching on: LV: 10 – 50%, MV: 10 – 15% | urban: 1 – 4 months | up to 30% for 10 ms up to 60% for 100 ms (EN 61000-6-1, 6-2) up to 60% for 1000 ms (EN 61000-6-2) |
| 5 | Short interruptions of supply voltage | LV, MV: (up to 3 minutes) few tens – few hundreds/year Duration 70% of them < 1 s | 95% reduction for 5 s (EN 61000-6-1, 6-2) | |
| 6 | Long interruption of supply voltage | LV, MV: (longer than 3 minutes) <10 – 50/year | ||
| 7 | Temporary, power frequency overvoltages | LV: <1.5 kV rms MV: 1.7 Uc (solid or impedance earth) 2.0 Uc (unearthed or resonant earth) | ||
| 8 | Transient overvoltages | LV: generally < 6kV, occasionally higher; rise time: ms – μs. MV: not defined | LV: generally < 6kV, occasionally higher; rise time: ms – μs. MV: not defined | |
| 9 | Supply voltage unbalance | LV, MV: up to 2% for 95% of week, mean 10 minutes rms values, up to 3% in some locations | 2% | 2% (IEC 61000-2-12) |
| 10 | Harmonic voltage | LV, MV: see Table 2 | 6%-5th, 5%-7th, 3.5%-11th, 3%-13th, THD <8% | 5% 3rd, 6% 5th, 5% 7th, 1.5% 9th, 3.5% 11th, 3% 13th, 0.3% 15th, 2% 17th (EN 61000-3-2) |
| 11 | Interharmonic voltage | LV, MV: under consideration | 0.2% | |
Table 1 – Various Power Quality Compliance Limits as Defined in EN 50160
| Odd Harmonics | Even Harmonics Not multiples | |||||
| Not multiples of 3 | Multip | les of 3 | ||||
| Order h | Relative voltage (%) | Order h | Relative voltage (%) | Order h | Relative voltage (%) | |
| 5 | 6 | 3 | 5 | 2 | 2 | |
| 7 | 5 | 9 | 1.5 | 4 | 1 | |
| 11 | 3.5 | 15 | 0.5 | 6…24 | 0.5 | |
| 13 | 3 | 21 | 0.5 | |||
| 17 | 2 | |||||
| 19 | 1.5 | |||||
| 23 | 1.5 | |||||
| 25 | 1.5 | |||||
Table 2 – Values of individual harmonic voltages at the supply terminals for orders up to 25, given in percent of Un
Appendix I_Tutorials
A. Power Quality Issues
1. Introduction
A short tutorial to introduce the subject of power quality phenomena, the problems they cause and their solutions.
2. Power Quality Phenomena
2.1 Harmonics
Harmonic frequencies are integral multiples of the fundamental supply frequency, i.e. for a fundamental of 50 Hz, the third harmonic would be 150 Hz and the fifth harmonic would be 250 Hz. Harmonic distorted waveform is clearly not a sine wave and that means that normal measurement equipment, such as averaging reading rms- calibrated multi-meters, will give inaccurate readings. Note also that there could be also many zero crossing points per cycle instead of two, so any equipment that uses zero crossing as a reference will malfunction. The waveform contains nonfundamental frequencies and has to be treated accordingly.
When talking about harmonics in power installations it is the current harmonics that are of most concern because the harmonics originate as currents and most of the ill effects are due to these currents. No useful conclusions can be drawn without knowledge of the spectrum of the current harmonics but it is still common to find only the total harmonic distortion (THD) figures quoted. When harmonics propagate around a distribution system, that is, to branch circuits not concerned with carrying the harmonic current, they do so as voltages. It is very important that both voltage and current values are measured and that quoted values are explicitly specified as voltage and current values. Conventionally, current distortion measurements are suffixed with ‘I’, e.g. 35% THDI, and voltage distortion figures with ‘V’, e.g. 4% THDV.
Harmonic currents have been present in the electricity supply system for many years. Initially they were produced by the mercury arc rectifiers used to convert AC to DC current for railway electrification and for DC variable speed drives in industry. More recently the range of types and the number of units of equipment causing harmonics have risen sharply, and will continue to rise, so designers and specifiers must now consider harmonics and their side effects very carefully.
2.2 Short interruptions (< 1min)
Disappearance of the supply voltage in all phases by some definitions also defined as in “One or more phases”. Usually qualified by an additional term indicating the voltage drop or retained voltage and duration of the interruption (e.g. Momentary, Temporary, or Sustained).
Values depend on standard.
Short interruptions:
IEEE = – _Un < 90% duration from 20 ms to 1 minute
EN= – _Un < 99% duration from 20 ms to 3 minutes
By some definitions short interruption is interpreted as a special kind of voltage dip.
2.3 Long interrupt ions (> 1min)
Disappearance of the supply voltage in all phases by some definitions also defined as in “…one or more phases”. Usually qualified by an additional term indicating the voltage drop or retained voltage and duration of the interruption (e.g., Momentary, Temporary, or Sustained).
Values depend on the source of the interruption.
Long interruptions:
IEEE = – _Un < 90% duration > 1 minute
EN= – _Un < 99% duration > 3 minutes
2.4 Voltage dips and swells
A voltage dip is a short-term reduction in, or complete loss of, RMS voltage. It is specified in terms of duration and retained voltage, usually expressed as the percentage of nominal RMS voltage remaining at the lowest point during the dip. A voltage dip means that the required energy is not being delivered to the load and this can have serious consequences depending on the type of load involved. Voltage sags – longer-term reductions in voltage – are usually caused by a deliberate reduction of voltage by the supplier to reduce the load at times of maximum demand or by an unusually weak supply in relation to the load.
Motor drives, including variable speed drives, are particularly susceptible because the load still requires energy that is no longer available except from the inertia of the drive. In processes where several drives are involved individual motor control units may sense the loss of voltage and shut down the drive at a different voltage level from its peers and at a different rate of deceleration resulting in complete loss of process control. Data processing and control equipment is also very sensitive to voltage dips and can suffer from data loss and extended downtime.
There are two main causes of voltage dips; starting of large loads either on the affected site or by a consumer on the same circuit and faults on other branches of the network.
Voltage swells – temporary increase in RMS value of AC voltage with the magnitude of the retained voltage between 110% and 180% of the rated voltage.
2.5 Transients, surges (switching, lightning)
Pertaining to or designating a phenomenon or a quantity, which varies between two consecutive steady states during a time interval that is short compared to the time scale of interest. A transient can be a unidirectional impulse of either polarity or a damped oscillatory wave with the first peak occurring in either polarity. Causes include switching or lightning strikes on the network and switching of reactive loads on the consumer’s site or on sites on the same circuit. Transients – surges can have magnitudes of several thousand volts and so can cause serious damage to both the installation and the equipment connected to it.
Electricity suppliers and telecommunications companies go to some effort to ensure that their incoming connections do not allow damaging transients to propagate into the customers’ premises. Nevertheless, non-damaging transients can still cause severe disruption due to data corruption. The generation and influence of transients is greatly reduced and the efficiency of suppression techniques greatly enhanced where a good high integrity earthing system has been provided. Such an earthing system will have multiple ground connections and multiple paths to earth from any point so ensuring high integrity and low impedance over a wide frequency band.
2.6 Flicker
Flickers are short duration voltage changes, resulting from switching, short-circuit and load changing. The permissible magnitude of light flicker is regulated by International Standards, based on perception criteria. Excessive flicker can cause migraine and is responsible for some instances of the so-called ‘sick building syndrome’.
2.7 Unbalance
A three-phase power system is called balanced or symmetrical if the three-phase voltages and currents have the same amplitude and are phase shifted by 120° with respect to each other. If either or both of these conditions are not met, the system is called unbalanced or asymmetrical. It is implicitly assumed that the waveforms are sinusoidal and thus do not contain harmonics.
In most practical cases, the asymmetry of the loads is the main cause of unbalance. At high and medium voltage level, the loads are usually threephase and balanced, although large single- or dual-phase loads can be connected, such as AC rail traction (e.g. high-speed railways) or induction furnaces (large metal melting systems employing highly irregular powerful arcs to generate heat).
Low voltage loads are usually single-phase, e.g. PCs or lighting systems, and the balance between phases is therefore difficult to guarantee. In the layout of an electrical wiring system feeding these loads, the load circuits are distributed amongst the three-phase systems, for instance one phase per floor of an apartment or office building or alternating connections in rows of houses. Still, the balance of the equivalent load at the central transformer fluctuates because of the statistical spread of the duty cycles of the different individual loads.
Abnormal system conditions also cause phase unbalance. Phase-to-ground, phase-to-phase and open-conductor faults are typical examples. These faults cause voltage dips in one or more of the phases involved and may even indirectly cause overvoltages on the other phases. The system behavior is then unbalanced by definition, but such phenomena are usually classified under voltage disturbances, which are discussed in the corresponding application guides, since the electricity grid’s protection system should cut off the fault.
2.8 Voltage value (long term undervoltages and overvoltages)
Long term voltage variations generally last for periods over several seconds. They are not the result of system faults. They may be caused by load variations, system switching operations and general system voltage regulation practices. Long term voltage variations can be either overvoltages or undervoltages, depending on the cause of the variation. They can influence voltage value sensitive equipment e.g. this under/overvoltage protected or voltage controlled equipment e.g. motors, overstress insulation.
2.8.1 UNDERVOLTAGES
An undervoltage is a decrease in the rms ac voltage (to less than 90% of rated voltage) at the power frequency for duration longer than several seconds (or even 1 minute).
2.8.2 OVERVOLTAGES
An overvoltage is an increase in the rms AC voltage (to more than 110% of rated voltage) at the power frequency for duration longer than several seconds (or even 1 minute).
2.9 Earthing and EMC
Earthing of installations and equipment is an issue that crosses the boundaries of the various disciplines involved in the construction and equipping of a modern commercial or industrial building. In general any earthing system needs to satisfy three demands:
- Lightning and short circuit: the earthing system must protect the occupants, prevent direct damage such as fire, flashover or explosions due to a direct lightning strike and overheating due to a short-circuit current.
- Safety: the earthing system must conduct lightning and short-circuit currents without introducing intolerable step-voltage and touchvoltages.
- Equipment protection and functionality: the earthing system must protect electronics by providing a low impedance path to interconnect equipment. Proper cable routing, zoning and shielding are important aspects and serve the purpose of preventing sources of disturbance from interfering with the operation of electrical equipment.
Although requirements for these three aspects are often specified separately, the implementation of them requires an integrated systems approach.
Every piece of electrical and electronic equipment produces some electromagnetic radiation. Similarly, every piece of equipment is also sensitive, to a greater or lesser extent, to electromagnetic radiation. If everything is going to work, the cumulative level of radiation in an environment must be rather less than the level that will disrupt the operation of the equipment working in that environment. To achieve this goal, equipment is designed, built and tested to standards to reduce the amount of radiation that is emitted and increase the amount that can be tolerated.
EMC is defined in the IEC 61000 series as:
“The ability of an equipment or system to function satisfactorily in its electromagnetic environment without introducing intolerable electromagnetic disturbances to anything in that environment.”
Maintaining this compatibility in practice requires great care in the design and implementation of the installation and the earthing system. Detailed guidance will be given in later sections of this Guide; here a general overview only is presented.
In traditional electrical engineering separate earthing systems were used, for example, signal earth, computer earth, power earth, lightning earth etc. etc. In today’s electrical engineering new insights have been gained on the aspect of earthing and grounding and its relation to instrument protection. The concept of separate earthing systems has been abandoned and the international standards now prescribe one overall earthing system. There is no such thing as ‘clean’ and ‘dirty’ earth. This single earthing concept means in practice that protective earth (PE) conductors, parallel earthing conductors, cabinets and the shields and screens of data or power cables are all interconnected. Also steel construction parts and water and gas pipes are part of this system. Ideally all cables entering a zone must enter at one point at which all screens and other earth conductors are connected.
To reduce interference on equipment the earthing loops between cable-screens and other earthing structures must be kept small. Bonding cables against metal structures makes these structures act as parallel earthing conductors (PEC). Parallel earthing structures are used both for data and power cables. Examples are, in ascending order of effectiveness: earthing wires, cable ladders, flat metal surfaces, cable trays or ultimately metal pipes. The PEC reduces the impedance of the loop formed by the cable and the earthing network. The earthing resistance to mother earth is mostly not important for the protection of equipment. A very effective form of a PEC is a densely woven or completely closed cable screen with a large metal cross-section, connected all around at both ends of the cable.
To keep the impedance of bonding connections in the earthing network small for high frequencies, litz wire (stranded, individually insulated) or metal strips with a length to width ratio smaller than 5 must be used. For frequencies higher than 10 MHz round wires should not be used.
A raised floor can serve as a good equipotential plane. The copper grid underneath it must have a maximum spacing of 1.2 meters and be connected to the common bonding network via many equipotential bonding conductors. The grid should be connected to a 50 mm2 copper ring placed around the raised floor area, within the boundaries of the floor, at 6 meter intervals. Power and signal cables should be at least 20 cm apart and where they cross, they should do so at right angles.
3. Power Quality Problems
3.1 Circuit breakers and RCD’s nuisance tripping
Inrush currents may trip circuit breakers. Circuit breakers may not correctly sum the current contained in the fundamental and various harmonics and so trip erroneously, or not at all when they should. Leakage currents may reach thresholds that cause residual current devices to trip.
3.2 Computers lock up
Earth current originating in the equipment results in a voltage drop between the equipment and true earth, although small, this noise voltage may be significant compared with the signal voltages (of a few volts) on which IT equipment operates. PC hardware is designed to minimise sensitivity to this kind of disturbance but it cannot be eliminated entirely, especially as the noise frequency rises. Modern communications protocols have error detection and correction algorithms built in, requiring retransmission of erroneously received data – and consequently reducing the data throughput. As a result, PCs will often slow down or lock-up, a frequent phenomenon in today’s office environments.
3.3 Computers or other electronics are damaged
Should lightning and switching strikes occur “close” to computers and other electronic equipment, they may completely damage the equipment if insufficient surge protection is available.
3.4 Data loss
Earth leakage currents cause small voltage drops along the earthing conductor. In a TN-C network, the combined earth-neutral conductor will constantly carry significant current, dominated by triple-n harmonics. Due to the increasing use of low-voltage signals in IT equipment, bit error rate increases up to the point where the entire network locks up or freezes. How many large and small, privately owned networks experience this phenomenon almost on a weekly basis? Where this happens, the network locks up, e-mail services fail and it is no longer possible to print for no apparent reason.
3.5 Lights flicker, blink, or dim
Short duration voltage changes resulting from switching, short-circuits and load changing can result in light flicker. The permissible magnitude of light flicker is regulated by International Standards and is based on perception criteria. The light blinking and dimming may also be a result of shorter and longer voltage sags, which are the consequence of large load fluctuation and too low local electrical system short circuit power.
3.6 Loss of synchronization of processing equipment
Severe harmonic distortion can create additional zero-crossings within a cycle of the sine wave; this can affect sensitive measurement equipment. Synchronization of process control equipment in continuous manufacturing may be disturbed and PLC devices may lock up.
3.7 Motors or other process equipment malfunctions
Voltage harmonics cause extra losses in direct line-connected induction motors. The 5th harmonic creates a counter-rotating field, whereas the 7th harmonic creates a rotating field beyond the motor’s synchronous speed. The resulting torque pulsing causes wear and tear on couplings and bearings. Since the speed is fixed, the energy contained in these harmonics is dissipated as extra heat, resulting in premature ageing. Harmonic currents are also induced into the rotor causing further excess heating. The additional heat reduces the rotor/stator air gap, reducing efficiency even further.
Variable speed devices cause their own range of problems. They tend to be sensitive to dips, causing disruption of synchronized manufacturing lines. They are often installed some distance from the motor, and cause different electromagnetic interference and voltage spikes due to the sharp voltage rise times. Special care has to be taken at start-up of motors after a voltage dip when the motor is normally operating at close to full load. The extra heat from the inrush current at start-up may cause the motor to fail. Optimum sizing of motors should mitigate this phenomenon.
3.8 Motors or process equipment are damaged
In extreme cases when the motor is operating in a high harmonic content environment it may be damaged because of overheating.
3.9 Noise interference to telecommunication lines
If the electrical noise cannot be reduced to a low enough level it will produce interference signals, which exceed telecommunication immunity level increasing transmission error rates.
3.10 Relays and contactors nuisance tripping
Relays and contactors are sensitive to voltage dips and can often be the weakest link in the system. It has been established that a device may drop out during a dip even when the retained voltage is higher than the minimum steady state hold-in voltage.
The resilience of a contactor to dips depends not only on the retained voltage and duration but also on the point on the waveform where the dip occurs, the effect being less at the peak.
3.11 Transformers and cables overheating
Harmonics produce extra eddy current losses. These losses lead to transformers and cables overheating. Additionally triple n harmonics add up and flow in neutral conductors and delta windings of transformers creating additional extra heat.
4. Power Quality solutions
4.1 Back-up generator(s)
Engine generating sets (EGS) usually consist of one or more internal diesel combustion engines as the source of mechanical energy, a generator to convert mechanical to electric energy, accelerators, control and regulation systems and switchgear. This type of equipment may be designed for relatively long-term operation, say up to several hours or days, or may be designed for continuous operation. EGSs are available in a wide range of power ratings, usually from a few tens of kW up to few MW. Instead of diesel engine there is sometimes installed a gas turbine to drive generator of a large power, in the range of few MW or more.
Generator sets driven by gas turbines are often designed as sources of power for peak lopping or as co-generation plants. The EGSs are also used for special applications where no power network is available, such as marine applications, or where a short-term, high demand requirement exists, such as major televised sports events. These kinds of using of EGSs will not be discussed in this guide. EGSs can operate in two different manners, distinguished here as group I and group II.
4.2 Dynamic voltage restorers
Where heavy loads or deep dips are concerned a Dynamic Voltage Restorer (DVR) is used.
This device is series coupled to the load and generates the missing part of the supply; if the voltage dips to 70%, the DVR generates the missing 30%. DVRs are normally expected to support the load for a short period and may use heavy-duty batteries, super capacitors or other forms of energy storage such as high-speed flywheels. DVRs cannot be used to correct long term under and over voltage.
4.3 Harmonic filter (passive)
Passive filters are used to provide a low impedance path for harmonic currents so that they flow in the filter and not the supply. The filter may be designed for a single harmonic or for a broad band depending on requirements. Sometimes it is necessary to design a more complex filter to increase the series impedance at harmonic frequencies and so reduce the proportion of current that flows back onto the supply. Simple series band stop filters are sometimes proposed, either in the phase or in the neutral. A series filter is intended to block harmonic currents rather than provide a controlled path for them so there is a large harmonic voltage drop across it. This harmonic voltage appears across the supply on the load side. Since the supply voltage is heavily distorted it is no longer within the standards for which equipment was designed and warranted. Some equipment is relatively insensitive to this distortion, but some is very sensitive. Series filters can be useful in certain circumstances, but should be carefully applied; they cannot be recommended as a general purpose solution.
4.4 Isolation transformers
As mentioned previously, triple-N currents circulate in the delta windings of transformers.
Although this is a problem for transformer manufacturers and specifiers – the extra load has to be taken into account – it is beneficial to systems designers because it isolates triple-N harmonics from the supply.
The same effect can be obtained by using a ‘zig-zag’ wound transformer. Zig-zag transformers are star configuration auto transformers with a particular phase relationship between the windings that are connected in shunt with the supply.

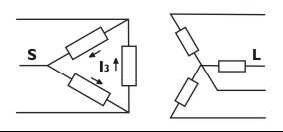
Figure 1 -Delta star isolation transformer. S -Supply, L -Load.
4.5 Line conditioners or active filters
The idea of the active harmonic conditioner is relatively old; however the lack of an effective technique at a competitive price slowed its development for a number of years. Today, the widespread availability of insulated gate bipolar transistors (IGBT) and digital signal processors (DSP) have made the AHC a practical solution. The concept of the AHC is simple; power electronics is used to generate the harmonic currents required by the nonlinear loads so that the normal supply is required to provide only the fundamental current. The load current is measured by a current transformer, the output of which is analyzed by a DSP to determine the harmonic profile. This information is used by the current generator to produce exactly the harmonic current required by the load on the next cycle of the fundamental waveform. In practice, the harmonic current required from the supply is reduced by about 90%.
Because the AHC relies on the measurement from the current transformer, it adapts rapidly to changes in the load harmonics. Since the analysis and generation processes are controlled by software it is a simple matter to programme the device to remove only certain harmonics in order to provide maximum benefit within the rating of the device.
A number of different topologies have been proposed and some of them are described below. For each topology, there are issues of required components ratings and method of rating the overall conditioner for the loads to be compensated.
4.6 Multiple independent feeders
Where the power requirement is high and the cost is justified, as in the case of continuously operating plant such as paper or steel making, two independent connections to the distribution grid may be provided. This approach is only effective if the two connections are electrically independent, i.e. a predictable single failure will not cause both network connections to fail at the same time. It depends on the network structure, and often, this requirement cannot be met without the use of very long (and expensive) lines. The use of two independent connections from the distribution network does not mean that other reserve supplies are unnecessary.
This type of measure is unlikely to reduce the number or severity of voltage disturbances however, because the networked nature of the distribution system allows dips – the effect of faults – to propagate over very long distances.
4.7 Oversizing equipment (transformers, motors) and cables (line and especially neutral conductors)
Transformers are affected in two ways by harmonics. Firstly, the eddy current losses, normally about 10% of the loss at full load, increase with the square of the harmonic number. In practice, for a fully loaded transformer supplying a load comprising IT equipment the total transformer losses would be twice as high as for an equivalent linear load. This results in a much higher operating temperature and a shorter life. In fact, under these circumstances the lifetime would reduce from around 40 years to more like 40 days! Fortunately, few transformers are fully loaded, but the effect must be taken into account when selecting plant. The second effect concerns the triple-N harmonics. When reflected back to a delta winding they are all in phase, so the triple-N harmonic currents circulate in the winding. The triple-N harmonics are effectively absorbed in the winding and do not propagate onto the supply, so delta wound transformers are useful as isolating transformers. Note that all other, non triple – N, harmonics pass through. The circulating current has to be taken into account when rating the transformer.
Harmonic voltage distortion causes increased eddy current losses in motors in the same way as in transformers. However, additional losses arise due to the generation of harmonic fields in the stator, each of which is trying to rotate the motor at a different speed either forwards or backwards. High frequency currents induced in the rotor further increase losses. Where harmonic voltage distortion is present motors should be de-rated to take account of the additional losses.
Alternating current tends to flow on the outer surface of a conductor. This is known as skin effect and is more pronounced at high frequencies. Skin effect is normally ignored because it has very little effect at power supply frequencies but above about 350 Hz, i.e. the seventh harmonic and above, skin effect will become significant, causing additional loss and heating.
Where harmonic currents are present, designers should take skin effect into account and derate cables accordingly. Multiple cable cores or laminated busbars can be used to help overcome this problem. Note also that the mounting systems of busbars must be designed to avoid mechanical resonance at harmonic frequencies.
4.8 Shielding and grounding
Earthing of installations and equipment is an issue that crosses the boundaries of the various disciplines involved in the construction and equipping of a modern commercial or industrial building.
In general any earthing system needs to satisfy three demands:
- Lightning and short circuit: the earthing system must protect the occupants, prevent direct damage such as fire, flashover or explosions due to a direct lightning strike and overheating due to a short-circuit current.
- Safety: the earthing system must conduct lightning and short-circuit currents without introducing intolerable step-voltage and touchvoltages.
- Equipment protection and functionality: the earthing system must protect electronics by providing a low impedance path to interconnect equipment.
Proper cable routing, zoning and shielding are important aspects and serve the purpose of preventing sources of disturbance from interfering with the operation of electrical equipment.
Although requirements for these three aspects are often specified separately, the implementation of them requires an integrated systems approach.
Shielding is the use of a conducting and/or ferromagnetic barrier between a potentially disturbing noise source and sensitive circuitry. Shields are used to protect cables (data and power) and electronic circuits. They may be in the form of metal barriers, enclosures, or wrappings around source circuits and receiving circuits.
4.9 Static transfer switches
AC power supply system – fast switching in the AC circuits by means of a static-switch. Apart from the basic component of AC highly reliable power supply systems (UPS), as a next step fast static switches can be used to increase the reliability of power supply.

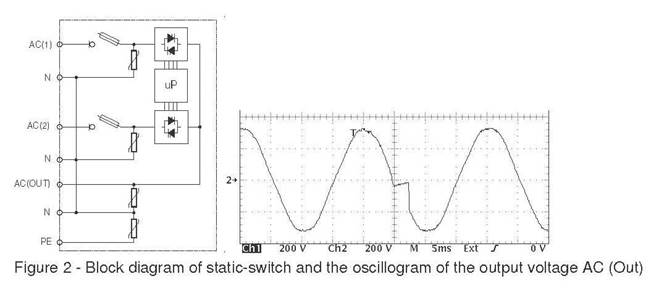
Figure 2 shows a diagram of the static-switch and an example of the oscillogram of power supply reconnection from AC circuit (1) to AC circuit (2).
The control system of static-switch should provide very quick switching of power networks; there are switches with switching time below 6ms and return to basic power supply of 0.2ms.
This ensures the uninterrupted operation of the loads even those, which are very sensitive to short supply voltage decays. Where the standard contactors are used, disruptions in power supply can last for as long as tens or even hundreds of milliseconds. Another advantage of static switches is that they do not generate switching overvoltages like standard contactors.
So their application in environments sensitive to overvoltages, like these with inductive loads is recommended.
Static switches are also used for operation in three-phase networks for currents of a dozen or so to a few hundred amperes. An important feature of static switches is a very high instantaneous overload capacity (e.g. 2000%/20ms).

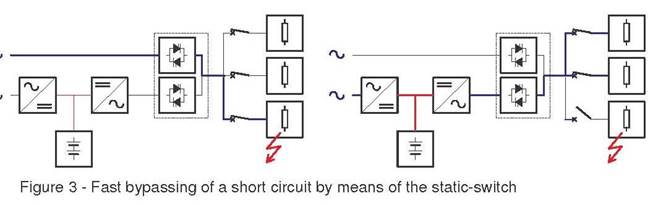
If there are several circuits supplied by the UPS and a short circuit occurs in one of them, then the input terminals of the UPS are earthed and the rest of the circuits is not supplied. This lasts until the fuses in the shorted circuit are blown. Very quick switching of the bypass circuit ensures very quick reaction of the fuse and provides much shorter break in power supply of other circuits. Returning to power supply from the UPS is very quick, too. This guarantees uninterruptible operation of the correctly operating loads connected to the UPS.
If two UPS systems are used (fig. 4a), the reliability of power supply of lines 1L and 2L can be significantly increased by installation of two additional static switches (fig.4b).

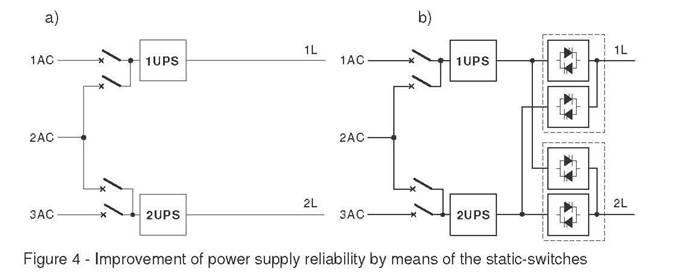
In this way we create a system in which each of the UPS units supplies ‘its own’ loads. In the event of a failure of one of the UPS, a static switch ensures very quick switching in such a way that the UPS which is operating at this moment correctly supplies both 1L and 2L circuits.
Instead of 2AC line, a power generator can be used, which ensures supply of lines 1L and 2L even in case of a long voltage decay in the power network.
The system shown also provides easy maintenance and service, which is important for a long lasting operation of the power supply system.
4.10 Static VAR Compensator
Finally, special fast-acting power electronic circuits, such as ‘Static Var Compensators’ can be configured to limit the unbalance. These behave as if they were rapidly changing complementary impedances, compensating for changes in impedance of the loads in each phase. Also, they are capable of compensating unwanted reactive power. However, these are expensive devices, and are only used for large loads (e.g. arc furnaces) when other solutions are insufficient.
The impact of cyclic loads, such as spot welders, can be mitigated by the use of a static VAR compensator that corrects power factor ‘on the fly’ and reduce the impact on the system.
4.11 Surge protectors on key pieces of equipment
These are nonlinear devices to limit the amplitude of voltage on a power line. The term implies that the device stops overvoltage problems (i.e. lightning). In actuality, voltage clamp levels, response times and installation determine how much voltage can be removed by the operation of an arrester.
To protect power supplies against lightning strikes it is necessary to use lightning current arresters. For a low residual voltage the lightning current arresters have to be coordinated with surge voltage arresters.
Lightning arrester spark gaps and varistor arresters that are connected in series have been used for lightning and surge voltage protection in low voltage systems for the last two decades. With relatively low internal energy conversion the spark gaps are capable of discharging several times nondestructive even in the event of very high lightning energy.
After sparkover they enable a low residual voltage level. The sparkover voltage with generally 4 kV is quite high. Therefore before the spark gap sparkover or upon non-reaching the sparkover voltage, a varistor arrester has to take over the voltage limitation. On the one hand, residual voltages that exceed the isolation coordination allowed for the devices in question to be protected, may not be generated; on the other hand varistor may not be overloaded. The values for the isolation coordination can be taken from the IEC 60364-4-443.
In order to avoid the power overload of the varistor arresters, both arresters – the spark gap as well as the varistor – are coordinated with each other. According to conventional procedure, an additional voltage is generated to counter the voltage dropping over the varistor by an inductivity that is switched between both arresters.
4.12 Uninterruptible power supply (UPS) devices
UPS systems are now commonly used as standby power supplies for critical loads, where the transfer time must be very short or zero. Static UPS systems are easily available in ratings from 200 VA to 50 kVA (single-phase) and from 10 kVA up to about 4000 kVA (three phase).
As well as providing a standby supply in the event of an outage, UPSs are also used to locally improve of power quality. The efficiency of UPS devices is very high, with energy losses ranging from 3% to 10%, depending on number of converters used and type of secondary battery.
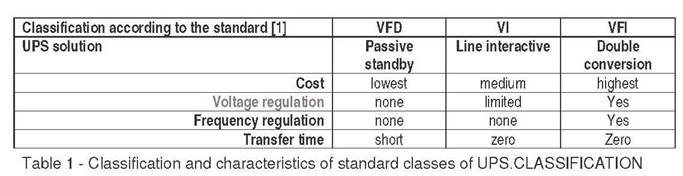
The basic classification of UPS systems is given in the standard IEC 62040-3 published in 1999 and adopted by CENELEC as standard EN-50091-3 [1]. The standard distinguishes three classes of UPS, indicating the dependence of the output voltage and output frequency from the input parameters:
- VFD (output Voltage and Frequency Dependent from mains supply),
- VI (output Voltage Independent from mains supply),
- VFI (output Voltage and Frequency Independent from mains supply).
➢
However, in practice this classification closely corresponds to classification by internal structure:
- Passive standby, ➢ Line interactive, ➢ Double conversion.

4.13 Voltage stabilizers
Most voltage dips on the supply system have a significant retained voltage, so that energy is still available, but at too low a voltage to be useful to the load. This section discusses voltage dip mitigation equipment that deals with this type of dip. No energy storage mechanism is required; they rely on generating full voltage from the energy still available at reduced voltage (and increased current) during the dip. These devices are generally categorized as automatic voltage stabilizers. Other types of equipment are available to deal with dips where the retained voltage is zero and are described in another section of this Guide. This section gives a basic description of each type of automatic voltage stabilizer. The advantages and disadvantages of each type have been listed to enable the appropriate choice of voltage stabilizer to be made for the particular application.
The main types of automatic voltage stabilizers are as follows:
- Electro-mechanical
- Ferro-resonant or constant voltage transformer (CVT)
- Electronic step regulators
- Saturable reactors (Transductor) ➢ Electronic voltage stabilizer (EVS).
An important point to note in the selection of an automatic voltage stabilizer is that the chosen solution must solve the particular problem without creating additional problems. One example of this would be to connect a ferro-resonant stabilizer to the output of an inferior generator to reduce voltage variations. The net result would be adversely affected by the frequency fluctuations of the inferior generator that would produce an AC voltage change of 1.5 % for each 1 % change of frequency.
PQ phenomena and design issues
PQ phenomena, problems and solutions approached by TPPQI have been processed to define a PQ – design issue table which has been used for interview design and installation model design.
B. Motor Starter-up Tutorials
A soft start-up eliminates the undesired side effects. Several types based on control of the supply voltage or mechanical devices such as slip clutches were developed. The list provides an overview of the various electric start-up types.
Direct on-line starting
- Three-phase motor with low to medium power rating
- 3 conductors to the motor
- High starting torque
- High current peak
- Voltage dip
- One simple switching device
Star-delta start-up
- Three-phase motor with low to high power rating
- Six conductors to the motor
- Reduced starting torque, 1/3 of the nominal torque
- High mains load due to current peak during switchover from Y to D
- High mechanical stress due to torque surge during switchover from Y to D
- Two or three switching devices, more maintenance
Soft start-up
- Three-phase motor with low to high power rating
- 3 conductors to the motor
- Variable starting torque
- No current peak
- No torque peaks
- Negligible voltage dip
- One simple switching device
- Optional: Guided soft stop, protective functions, etc. • Zero maintenance
- Compared to contactor solutions, soft starters, sometimes also referred to as soft starting devices, offer considerable advantages.
Torque surges entail high mechanical stress on the machine, which results in higher service costs and increased wear. High currents and current peaks lead to high fixed costs charged by the power supply companies (peak current calculation) and to increased mains and generator loads.
A soft starter continuously controls the three-phase motor’s voltage supply during the start-up phase. This way, the motor is adjusted to the machine’s load behavior. Mechanical operating equipment is accelerated in a gentle manner. Service life, operating behavior and work flows are positively influenced.
C. Energy Saving Electronic ballast
1. Purpose of a Ballast
Why is that black rectangular box contained in a fluorescent light fixture called a ballast? Isn’t the term ballast the name given to the heavy objects that are at the bottom of a large ship. Actually, a ballast is defined as anything that adds stability or steadiness. In that sense, it is the perfect name for the function that the black box provides to the fluorescent lighting system. As a ship’s ballast stabilizes the vessel, so does a light’s ballast stabilize its operation. A ballast is a device that is used with fluorescent and other discharge lamps to provide the required current and voltage. The primary function is to provide the lamp with high voltage and/or cathode heating during start-up, and then to stabilize the arc by limiting the electrical current to the lamp. In addition, some ballast’s can provide power quality correction and dimming capabilities.
Specifications
Ballast specifications are based on the number of lamps (1 – 4) served by the ballast, the type of lamp it is for, and line voltage. For example: “two lamp F40T12 120V ballast.” is designed for two 40 watt, T12, lamps which operates on 120V input. Ballast’s are available in rapid start (lamps in series) or instant start (lamps in parallel) configurations. Ballast’s for tube fluorescent lamps are attached inside the fixture behind the reflector. A Ballast in one fixture can be used to drive up to four lamps in up to four fixtures. Ballast’s for compact fluorescent and high intensity discharge lamps are usually located in the base of the lamp.
Efficiency
Ballast efficiency is measured by 1) the Ballast Factor which is the ratio of the actual light output of the lamp when operating with the ballast versus the specified lamp light output, and 2) the additional power that the ballast draws over and above the lamps. Power factor (power used/line volts x line amps) and harmonic distortion are also important characteristics of ballasts.
2. Electronic vs. Electromagnetic
There are two basic types of ballasts: low-frequency magnetic ballasts and high-frequency electronic ballasts. The functions of the two types of ballasts are essentially the same; that is, they control the starting and operating characteristics of the electricity for the appropriate fluorescent lamp. The primary difference is in the frequency delivered to the lamps and, obviously, the components that generate the frequencies.
Magnetic Ballasts
The magnetic ballast uses a magnetic transformer ofcopper windings around a steel core to convert theinput line voltage and current to the voltage andcurrent required to start and operate the fluorescentlamps. Capacitors are added to assist lamp startingand power factor correction. But the outputfrequency is the same as the input frequency (60Hz).
Electronic Ballasts
Electronic ballast uses integrated circuitry to perform all functions of the ballast. It rectifies the 60 Hz AC input to DC and then produces a very high frequency current (20,000 – 50,000 Hz) using an inverter and power conditioning components. In most models, the electronics are also used to provide current limitation, and improve power factor. Use of controllable integrated circuits in electronic ballast allows the output to be varied and the fluorescent lamps dimmable in response to manual or automatic (sensor) control. Some “hybrid” ballasts use some electronic circuitry to produce the high frequency current but use conventional current limiting and power factor correction components. Reliable integrated circuit electronic ballasts are available in Canada only at 120 volts and 277 volts (US standard). Electromagnetic ballasts are available in 120 and 347 volts.
3. Performance and Advantages of Electronic Ballasts
Energy Savings
The primary advantage of electronic ballasts is that they draw less power and therefore provide energy savings. For example, magnetic ballasts consume 12 or 13 watts internally, whereas the electronic ballasts may consume only 4 watts. The lower power consumption also means that there is less heat generated by the ballast resulting in lower operating temperatures. The lower fixture temperatures and high frequency operation causes the lamps, themselves, to operate up to 10% more efficiently, i.e. the ballast factor is improved.
TYPICAL SAVINGS
-Standard electromagnetic ballast driving two amps draws 82 watts
-Electronic ballast operating the same lamps draws 60 watts
-Savings 27% on Electronic ballasts
Reduced Flicker, Noise and Weight
Electronic ballasts also provide additional benefits to fluorescent lighting systems. A characteristic flicker can occur from magnetic ballasts that are produced from the low frequency 60 Hz input.
High-frequency ballasts eliminate the flicker. Minimising light flicker improves the overall light quality and can enhance work performance1. Electronic ballasts also weigh less than magnetic ballasts. Finally, the characteristic hum of magnetic ballasts is also eliminated.
Temperature and Life
Electronic ballasts operate at lower temperatures than magnetic ballasts, increasing lamp life, and reducing air conditioning and maintenance costs.
BENEFITS OF ELECTRONIC BALLAST
- Noise typically 25% less than magnetic
- Weight typically 50% less than magnetic
- Operating temperature 30 dig C lower than magnetic
Lamp Dimmability
One of the most significant features of full integrated circuit electronic ballasts for future lighting system designs is its “dimmability”. With the addition of light-level sensors, electronic ballasts can provide optimum power to the lamp to maintain a constant level of light as daylight increases and decreases through the day. In day lit perimeter spaces, daylight dimming can save up to half the lighting energy. In addition, dimming features can automatically increase light levels as the lamps age or reduce light levels when new lamps are installed. The ability to dim fluorescent lighting means that light “management” is now possible. (See the Automated Lighting Controls Technology Information Sheet).
Other Benefits
Low-frequency magnetic ballasts will consume power even after the lamps have failed. Most high frequency electronic ballast is designed with builtin circuitry to cut out when the lamps are not operating. Finally electronic ballasts run on AC or DC and can be used to drive several lamp types (e.g. all rapid start T12s, T10s and T8s), whereas electromagnetic ballasts must be matched with the specific lamp types. This makes retrofitting with electronic ballasts easier. Other information about ballasts can be obtained through publications listed on Efficient Lighting Reference List.
4. Other Issues
Power Factor
Complex electrical loads (other than simple resistive loads) have elements that change the ratio of the useable power to the supplied power. In other words, more supply power is required than is utilised. This is defined as the power factor. Most utilities penalise companies that have a low power factor. Both magnetic and electronic ballasts have components that reduce the power factor ratio2; in some cases it is less than 85%. Electronic ballasts are now capable of power factor ratings of over 95% (some manufacturers claim greater than 99%). When purchasing ballasts it is important to ensure they have a power factor equal to or greater than 95%.
Total Harmonic Distortion
Many electrical devices, especially electronicdevices, can produce a harmonic distortion of theshape (sine wave) of the electrical wave form. Thisdistortion degrades the quality of the electricity andcan subsequently decrease the effectiveness andefficiency of the equipment. Total HarmonicDistortion is defined as a ratio of the sum of all theharmonics over the magnitude of the fundamentalpower. Most magnetic ballasts have a totalharmonic distortion between 18% and 35%. Mostelectronic ballasts have the total harmonic distortionbelow 20% with some below 10%. It is advised topurchase ballasts that have low distortionspecifications.
Environmental Impact
Electromagnetic ballasts used to contain PCB’s, but have not done so for many years.